Day 3 Designed Experiments Review
September 3rd
3.1 Announcements
- Assignment 1 is due today!
- Assignment 2 is posted and due next week.
- Applied Linear Mixed Models Workshop 09/13-09/14. Workshop is full. Email me if you still want to join.
- Read Chapter 2 of Stroup’s GLMM book (this chapter only, 1ed>2ed).
3.2 Semester project
- Proposal due September 24th – see example 1 | see example 2
- Must contain: Background, Objectives.
- Data for the project must be ready to go.
- Final product: Manuscript + Tutorial.
- Working in teams vs. solo.
- Start as soon as possible!
3.3 Designed experiments
Let’s review the basics of designed experiments:
- Research question
- Planning the experiment
- Treatment structure - directly dependent on the research question
- Design structure - mostly depending on logistics. May depend on the research question.
3.3.1 Design structures
While the treatment structure defines what effects we will try and estimate as precisely as possible, the design structure tells us the story of how those treatments were applied. Some of the most common designed experiments include
- completely randomized design (CRD),
- randomized complete block design (RCBD),
- split-plot design,
- relevant variations to the designs above:
- generalized randomized complete block design,
- strip-plot design,
- repeated measures designs.
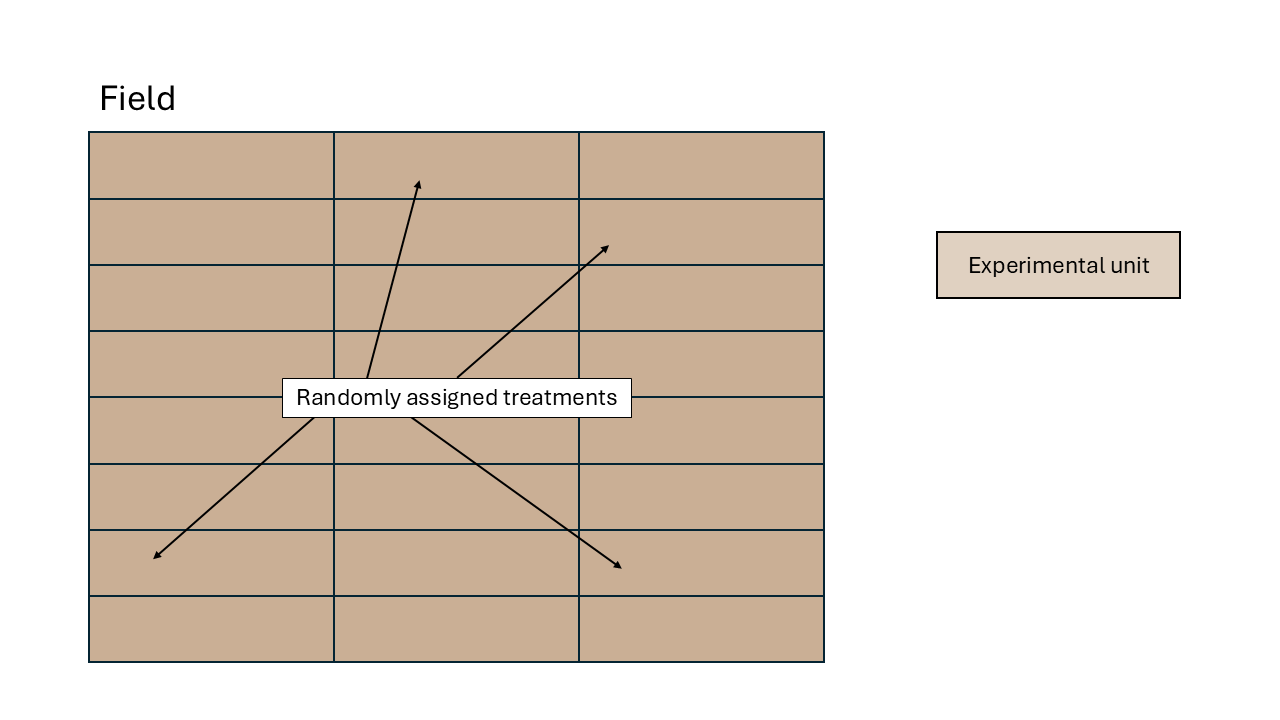
Figure 3.1: Schematic description of an experiment with a completely randomized design
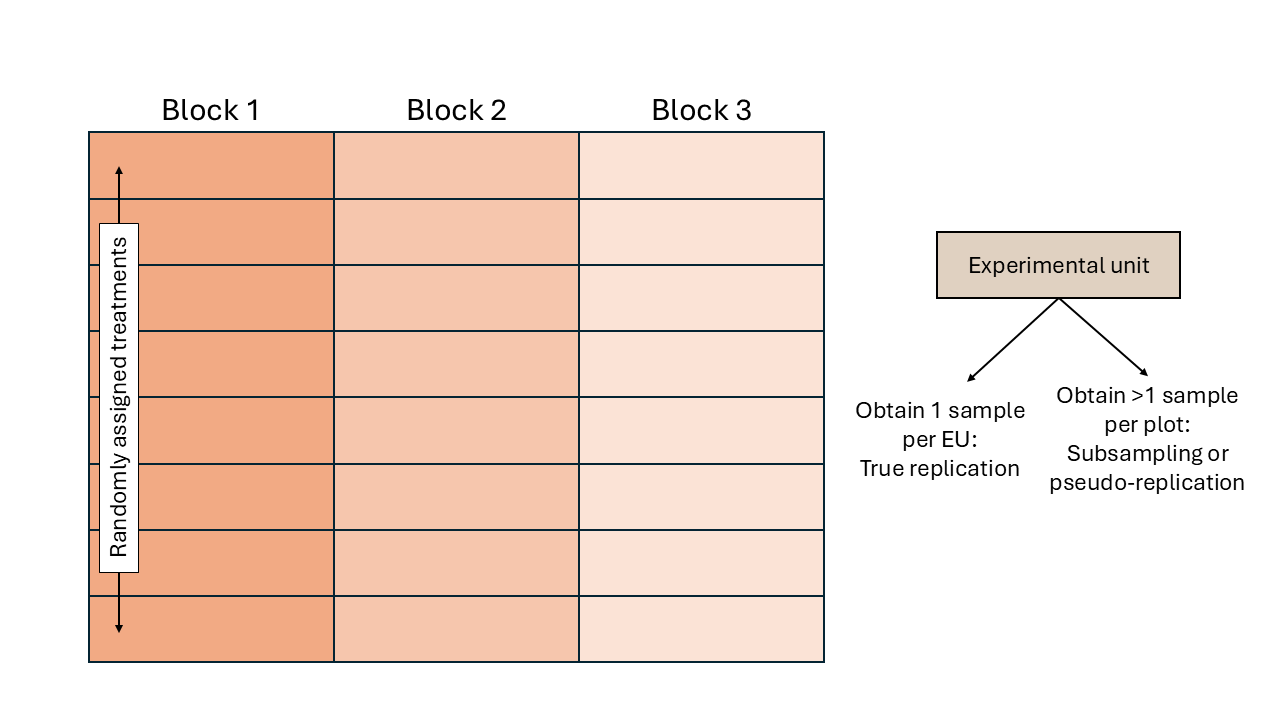
Figure 3.2: Schematic description of an experiment with a randomized complete block design

Figure 3.3: Schematic description of a field experiment with a split-plot design
3.4 Applied example: fungicide effects on barley genotypes
Let’s consider an experiment that aimed to study the effect of fungicide and barley genotypes on grain yield. The study includes two levels of fungicide, and 70 different genotypes, considering all their possible combinations.
- What is the treatment structure of the experiment?
- Do we know the design structure of the experiment?
Now, the actual experiment was run like this:
df_fungicide <- agridat::durban.splitplot

df_fungicide %>%
  ggplot(aes(bed, row))+
  coord_fixed()+
  geom_tile(aes(fill = fung))+
  geom_tile(aes(), color = "black", fill = NA)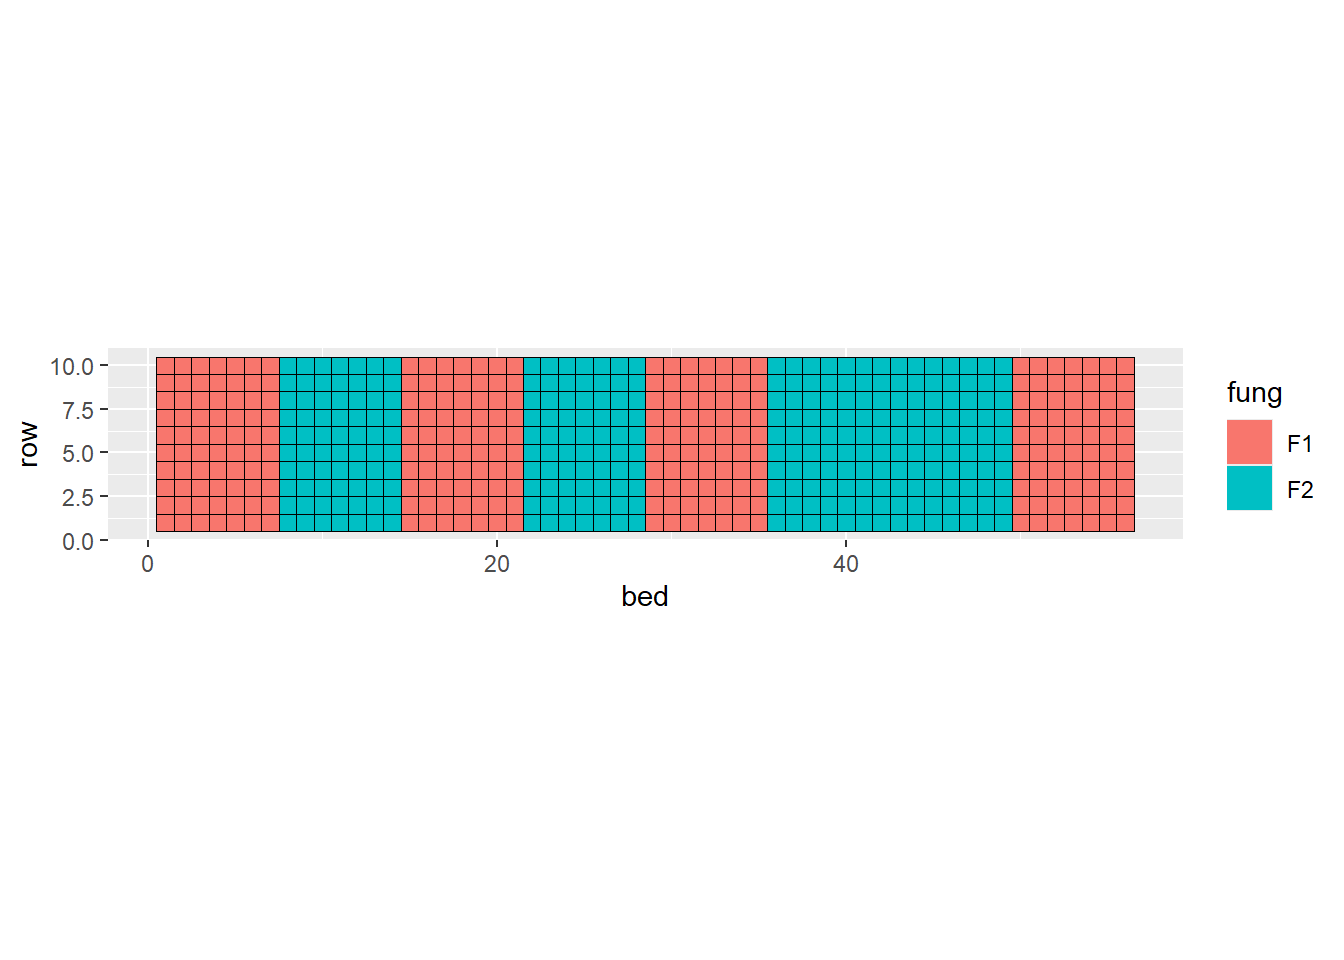
- What is the treatment structure?
- What are the experimental units?
- How many independent observations per treatment factor?
- What is the design structure?
3.5 Homework & Announcements
- Assignment 1 due today.
- Applied Linear Mixed Models Workshop is full. Email me if you still want to join.