Day 21 Zero-inflated models practice
21.1 Announcements
- Classes for Nov 10 and Nov 13 are replaced for assignments 6 & 7:
- Assignment 6: Google Docs due Friday 11/14
- Assignment 7: Project
21.2 In-class activity
A collaborator has sent you the following question:
Dear Sir or Madam,
I am writing because I’ve been having trouble analyzing a set of data. The data arise from an experiment that aimed to study the effect of herbicides on the survival of weeds.
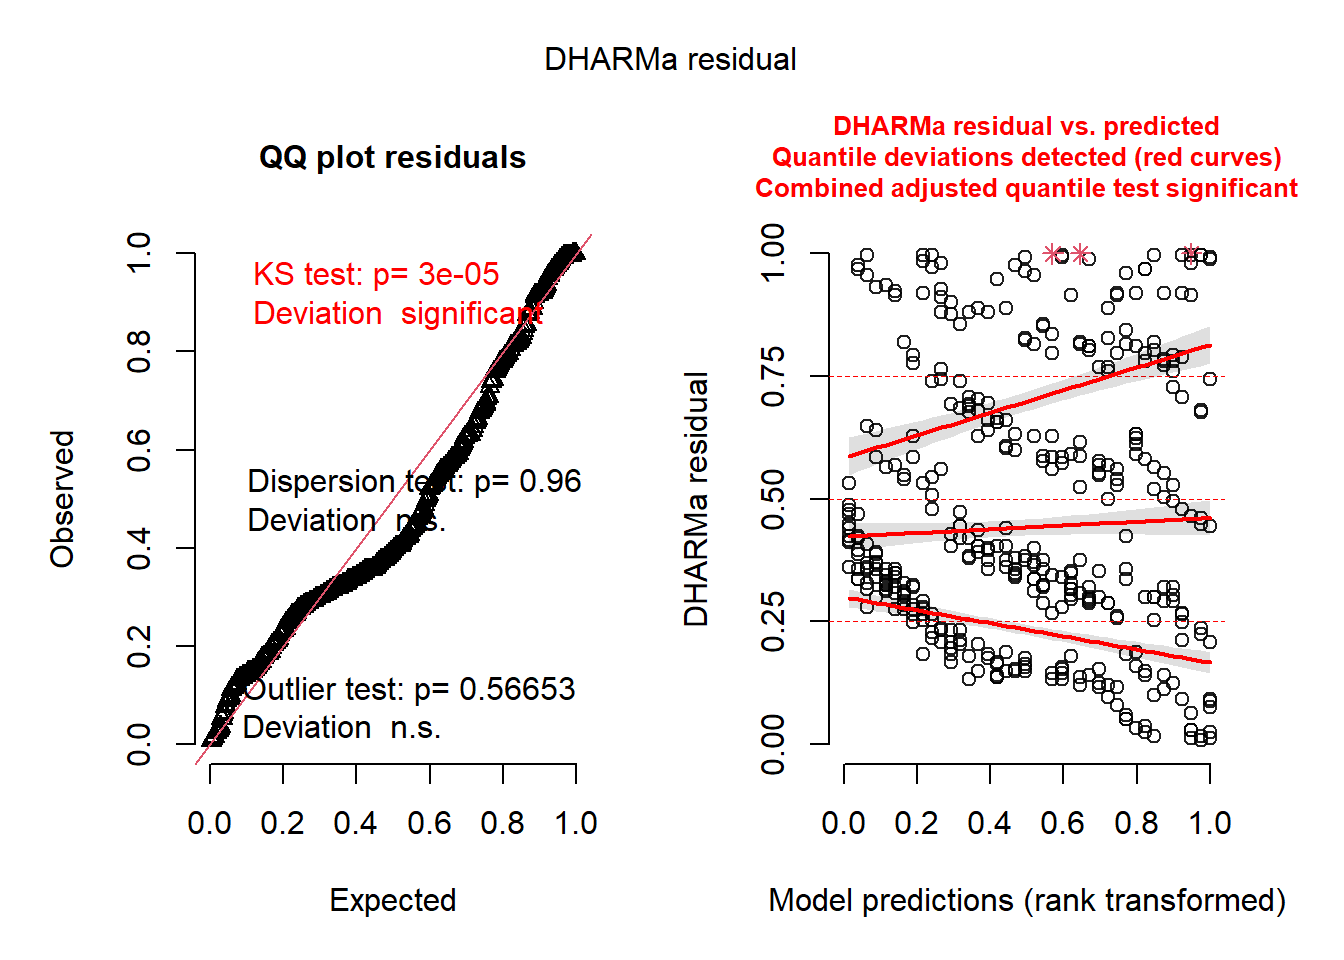
In this experiment, our treatment structure was a one-way factorial (control + 3 herbicides), and the design structure was an RCBD with 10 blocks, where the blocking factor are different locations. All locations were approximately similar, no need to model Trt \(\times\) Loc interaction. In each location, we repeated each treatment once once but measured the weed survival 10 times in random points of each plot (these plots were quite large!). Weed survival was measured as the number of weeds in a 1m^2 square frame that was tossed randomly in the area that had the weed treatment.I was in the middle of data analysis when I was checking the model assumptions and there seems to be something wrong (see DHARMa diagnostic plots below). Now, reading the documentation of the
DHARMaR package, I understand that sometimes we could find “significant” patterns in the residuals, but the model might not be bad to use. More specifically, the text states that “A residual pattern does not indicate that the model is unusable: While a significant pattern in the residuals indicates with good reliability that the observed data did likely not originate from the fitted model, this doesn’t necessarily imply that the inferential results from this wrong model are not usable. There are many situations in statistics where it is common practice to work with “wrong models”. For example, many statistical models use shrinkage estimators, which purposefully bias parameter estimates to certain values.”.My question: does that mean that this model is usable? If not, what changes would you make? Below is the model I am trying to fit and some diagnostic plots for your reference.
Task: answer this email to your colleague, mentioning statistical models in your justification for (yes it’s ok / no it’s not ok).
library(tidyverse)
library(ggpubr)
library(glmmTMB)

url <- "https://raw.githubusercontent.com/stat870/fall2025/refs/heads/main/data/herbicide_study.csv"
d <- read.csv(url) |>
  mutate(location = as.factor(location))

d |>
  ggplot(aes(herbicide, plant_count))+
  geom_point(aes(fill = herbicide), shape = 21, alpha = .3, size = 5, color = "black")+
  labs(fill = "Herbicide",
       y = "Plant count")+
  theme_pubclean()+
  scico::scale_fill_scico_d(palette = "hawaii")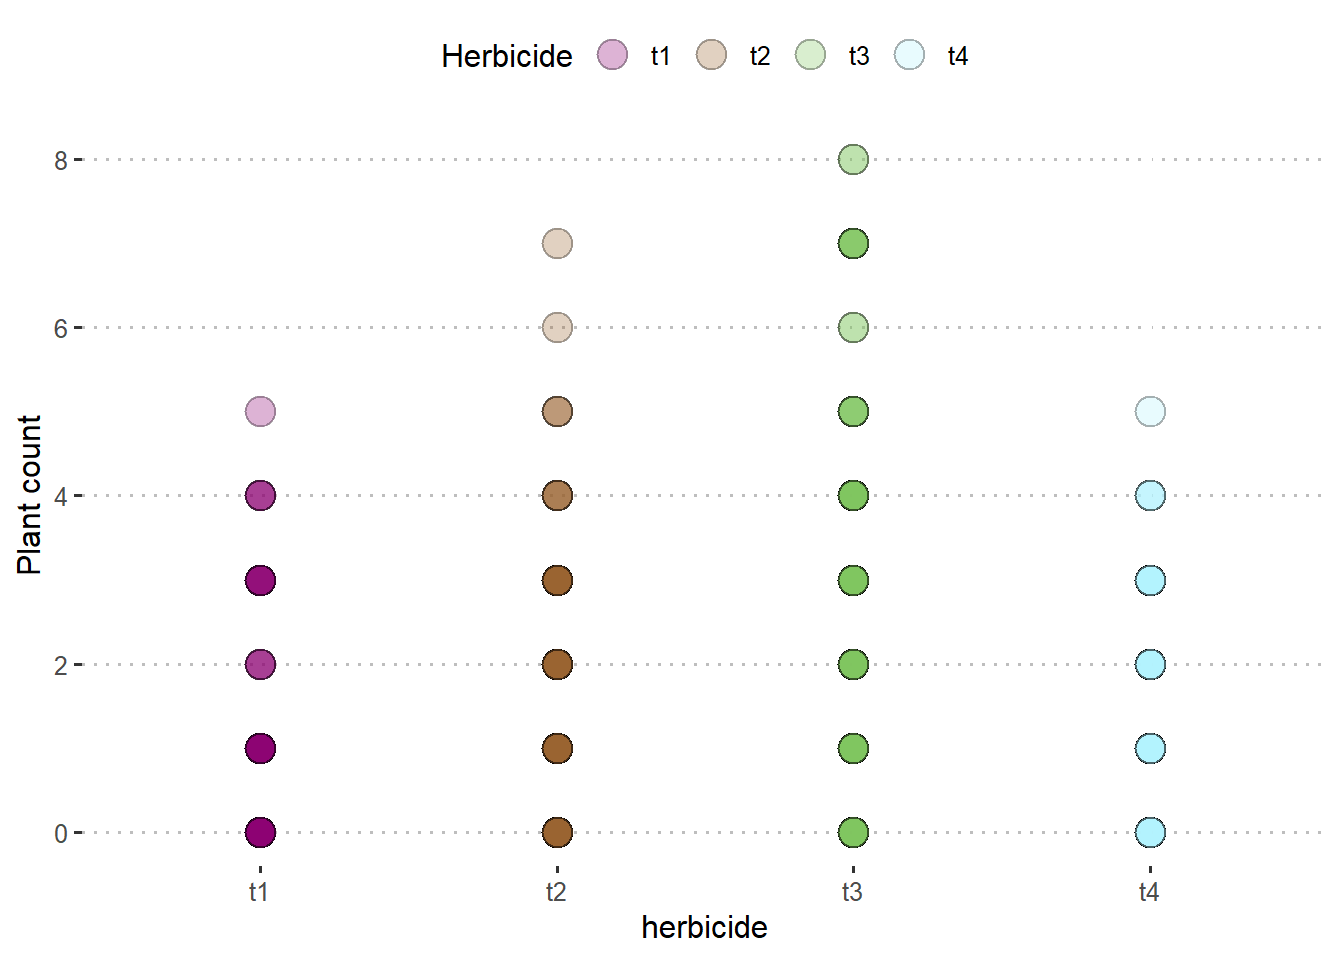
m0 <- glmmTMB(plant_count ~ herbicide + location, data = d)
r <- DHARMa::simulateResiduals(m0)
plot(r)