Day 2 Designed Experiments Review
August 27th
2.1 Announcements
- Assignment 1 is due next Wednesday.
- Applied Linear Mixed Models Workshop 09/13-09/14. Workshop is full. Email me if you still want to join.
2.2 Designed experiments
The golden rules of designed experiments:
- Replication
- Randomization
- Local control
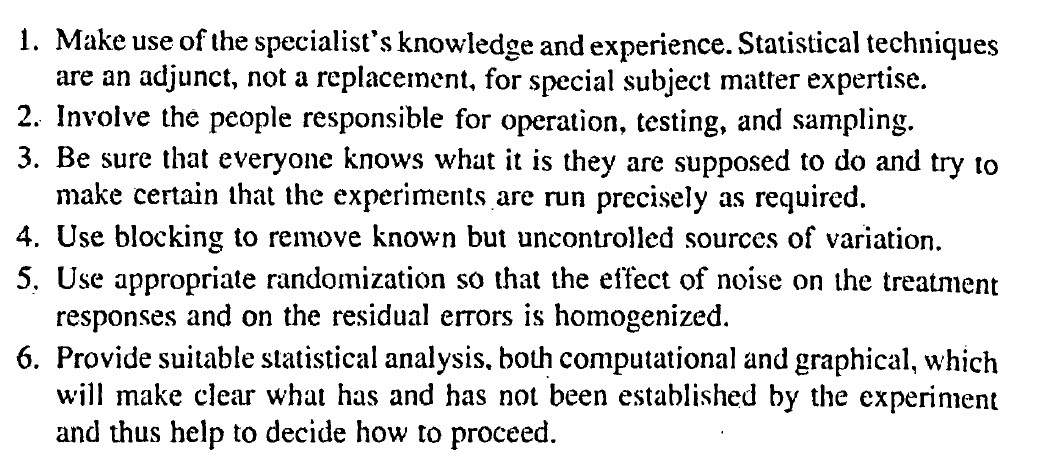
Figure 2.1: Principles for conducting valid and efficient experiments. From Box, Hunter and Hunter (2005).
- About George Box I - A Conversation with George Box [link]
- About George Box II - An Accidental Statistician: The Life and Memories of George E. P. Box [link]
2.2.1 Treatment structure
- Solely about the treatment.
- Most likely connected to the research question and thus defined by the subject matter expert.
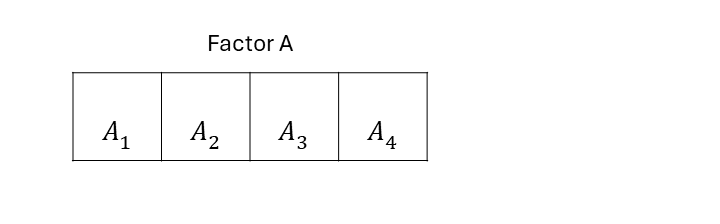
Figure 2.2: Schematic representation of a one-way treatment structure.
A one-way treatment structure means that the expected value of the observations, \(y\), is affected by one treatment factor with \(k\) levels:
\[g(\mu_{ij}) = \eta_{ij} = \eta_{0} + T_i,\] where:
- \(\mu_{ij}\) is the expected value of \(y_{ij}\), the observation of the \(i\)th treatment and \(j\)th repetition,
- \(g(\cdot)\) is the link function, that ensures that the mean is within the support of the chosen distribution,
- \(\eta_{ij}\) is the linear predictor of \(g(\mu_{ij})\),
- \(\eta_{0}\) is the overall mean, and
- \(T_i\) is the effect of the \(i\)th level of the treatment \(T\).
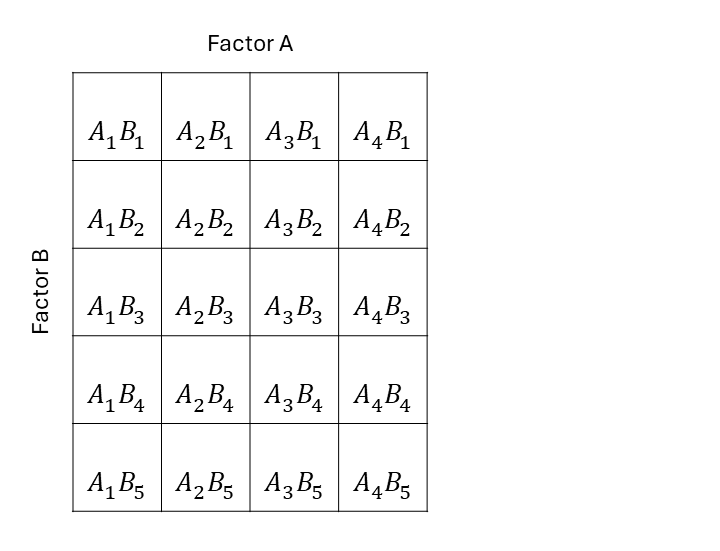
Figure 2.3: Schematic representation of a two-way factorial treatment structure.
A two-way treatment structure is similar to a one-way treatment structure, only now the expected value is affected by two treatment factors:
\[g(\mu_{ijk}) = \eta_{ijk} = \eta_{0} + T_i + G_j + (TG)_{ij} ,\] where:
- \(\mu_{ijk}\) is the expected value of \(y_{ij}\), the observation of the \(i\)th treatment \(T\), \(j\)th treatment \(G\), and \(k\) repetition,
- \(g(\cdot)\) is the link function, that ensures that the mean is within the support of the chosen distribution,
- \(\eta_{ijk}\) is the linear predictor of \(g(\mu_{ijk})\),
- \(\eta_{0}\) is the overall mean,
- \(T_i\) is the effect of the \(i\)th level of the treatment \(T\),
- \(G_j\) is the effect of the \(j\)th level of the treatment \(G\), and
- \((TG)_{ij}\) is the interaction between the \(i\)th level of treatment \(T\), and \(j\)th level of treatment \(G\).
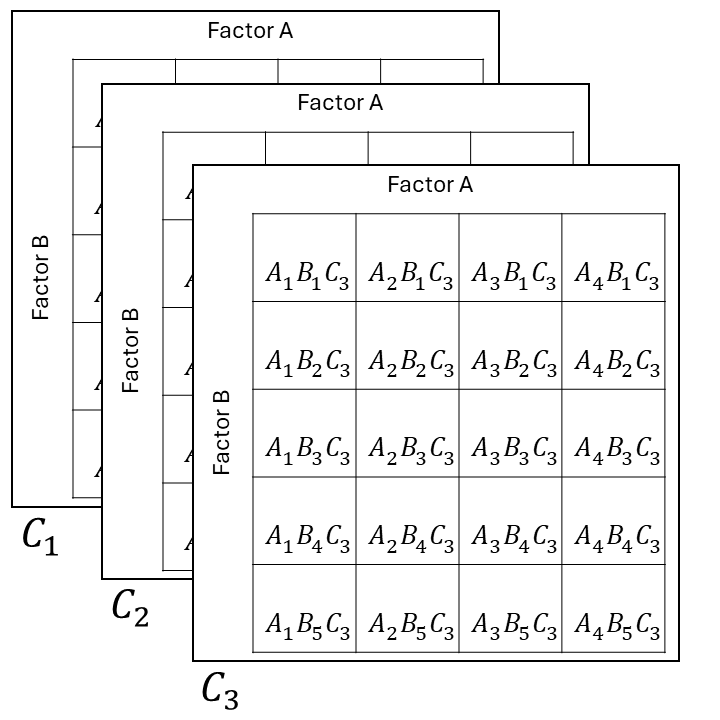
Figure 2.4: Schematic representation of a tree-way factorial treatment structure.
2.2.2 Design structure
The experiment design describes the data generating process (“blueprint” of the data).
- You’ll notice that the models above only consider the treatment sources of variability to explain variations in the observed values.
- How were the treatments above (logistically) applied?
Useful questions:
- What is the experimental unit?
- What is the blueprint of the design? (which observations are similar to what)
2.3 Homework & Announcements
- Submit Assignment 1 by next Wednesday.
- Applied Linear Mixed Models Workshop is full. Email me if you still want to join.